TL:DR – In 2012, I took part in a big clinical study on metabolism, weight, body fat, and liver function.
UPDATE: 2012-05-08 Checked my weight again today, down about 5 kg on the weight they recorded in the Fenland Study.
UPDATE: 2012-04-18 It will be two months tomorrow since I took part in the Fenland Study and got back the worrying metrics on liver enzymes, total cholesterol, body fat percentage etc. Since then, I have cut down on certain liquid refreshments, abandoned salted snacks and chip shop chips (with one lapse in Aldeburgh last week, well you have to, don’t you?). Last readings from GP for cholesterol (down from 6.5 to 5.0) and liver enzymes were pretty much fine and I’ve also shed about 4 kilograms, which isn’t bad and I haven’t had a gym-based workout for at least two weeks having opted for long hikes with the dog on our recent trip to The Cotswolds.
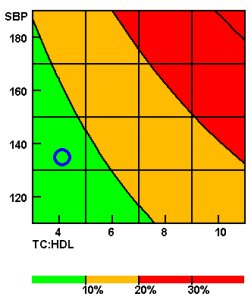
 To be frank, I’ve decided that you really don’t need to know my detailed waist-to-hip ratio, my weight, body fat percentage or any of the other details I am now poring over thanks to the good people at the MRC Epidemiology Unit. None of them are particularly bad…none of them are particularly good. I think I’m in the middle of the ranges for almost all the metrics they acquired, although the DEXA data shows that I’m proportionally rather more fat by percentage body mass than I’d hoped to be by the time I reached my mid-forties. My total fasting cholesterol is bit higher than it should be but the ratio of “good” to “bad” cholesterol is very good (my GP showed me I’m well into the green zone for cardiovascular risk. Nevertheless, she still advised me to cut out the saturated fats and eat more fruit and veg though (isn’t that part of the GP’s standard script, anyway?). She also advised me not to worry about the spurious liver test result mentioned in part 1 and simply to cut back on the old chianti a tad (but, that’s also part of the script, isn’t it?).
Meanwhile, with the specific data in hand, I turned to various health risk calculators on the web all of which take as input BMI, weight, cholesterol, blood pressure, body fat and other measurements as input. It’s interesting to see that even if I lost 10kg, cut my total cholesterol in half and reduced my waistline by an inch or two my 10-year risk of having a cardiovascular event would fall by very little. These things are all risk factors, they are not terms of predestination.
One CV risk calculator puts it more graphically (pardon the pun) on the basis of blood pressure, total cholesterol and HDL. It says my current risk is about 8.4%. That means that over the next decade I have an 84 in a 1000 chance of developing cardiovascular disease, with its associated risk of heart attack or a stroke. The risk of actually having such an event or dying in that time are different again (lower thankfully). Nevertheless, by getting my cholesterol level down, losing a bit of weight and reducing my systolic blood pressure reading by about 10 mmHg (which should happen with the weight loss), I could reduce my risk, according to the calculator to about 5%. That is actually a change in odds from about 11:1 to approximately 25:1. Is that a good enough reason to revise my diet and exercise regime when the chips are down? I think so…
 Of course, it could be that the total cholesterol was up because of a spot of unusually rich living and partying the week before the Fenland tests. That would also explain the fact that without effort my weight had shifted down within a week of the tests by a couple of kg. That’s my excuse and I’m sticking to it. Similiarly with the liver test. Indeed, given that the other values were all fine it makes me wonder whether I am one of the 9% of people who have a permanently raised reading on that test regardless of alcohol consumption or what meds they are on.
Regardless, I’ve got a follow-up cholesterol test booked with my GP for a couple of weeks time, hopefully that cholesterol risk will be down of its own accord before then (I’ve had a week of vegetarianism and a hepatic sabbatical so far and have not touched any crisps for at least a week). Then, I would have to simply focus on shuffling some of those other percentages. I reckon my normal total cholesterol is probably closer to what it was the last time I had it tested, which was fine and gives me a current risk of closer to 6% than 8% (15:1 risk of CV disease). Nudge it down a little and knock off another 2kg and I could reduce that risk to about 5% about 20:1). Of course, one of the worst things to do is to raise stress hormone levels by worrying about all those kgs, mmol/l and mmHg. I’d take a chill pill if I thought it wouldn’t affect the liver tests…
 I hope things have changed a little since the bad old days when professors suggested that members of their research team ought to work all day, every day, including evenings and weekends, public holidays and could only have time off for a vacation if it had been well earned. It’s possible that an original letter reproduced a while  back was actually meant tongue-in-cheek, it’s hard to say but the letter sent to “Guido” lit a fire under the science work ethic debate.
 To be frank, I’ve decided that you really don’t need to know my detailed waist-to-hip ratio, my weight, body fat percentage or any of the other details I am now poring over thanks to the good people at the MRC Epidemiology Unit. None of them are particularly bad…none of them are particularly good. I think I’m in the middle of the ranges for almost all the metrics they acquired, although the DEXA data shows that I’m proportionally rather more fat by percentage body mass than I’d hoped to be by the time I reached my mid-forties. My total fasting cholesterol is bit higher than it should be but the ratio of “good” to “bad” cholesterol is very good (my GP showed me I’m well into the green zone for cardiovascular risk. Nevertheless, she still advised me to cut out the saturated fats and eat more fruit and veg though (isn’t that part of the GP’s standard script, anyway?). She also advised me not to worry about the spurious liver test result mentioned in part 1 and simply to cut back on the old chianti a tad (but, that’s also part of the script, isn’t it?).
 Of course, it could be that the total cholesterol was up because of a spot of unusually rich living and partying the week before the Fenland tests. That would also explain the fact that without effort my weight had shifted down within a week of the tests by a couple of kg. That’s my excuse and I’m sticking to it. Similiarly with the liver test. Indeed, given that the other values were all fine it makes me wonder whether I am one of the 9% of people who have a permanently raised reading on that test regardless of alcohol consumption or what meds they are on.
 NHS Choices finally published its critique of the Harvard red meat research that had the tabloids screaming that meat kills earlier this week. I provided some commentary on Sciencebase soon after. Anyway, this is what NHS Choices concludes:
 Quite coincidentally, given the moon hour-by-hour video I posted earlier today, a press release just arrived waxing lyrical about gazing up at the night sky and seeing the familiar face of the “Man in the Moon”. The synchronous rotation of the Moon means it takes about the same amount of time to rotate on its axis as it does to orbit once around the Earth, which means the Moon’s “eyes” are always fixed in our direction, in other words the familiar hemisphere is always facing Earth. The “dark” side of the moon is not, as a matter of fact dark, it is frequently exposed to sunlight, it’s just that we don’t see it from Earth. But why was it the “facial” side of the Moon that ended up locked facing the Earth?
 I was planning to write an “appraisal” of the Harvard study on meat and risk of death that hit the news today, but have been so busy procrastinating lately that another blog has beaten me to it. Apparently, we should all be eating less meat, particularly processed meat like sausages, bacon and burgers because not eating less will kill us. At least, that’s what the headlines and the tabloid stats seem to imply. 20% increased risk if you eat 3 or 4 beef steaks every week?
 Is there a link between carbon emissions in the developing world and reproductive health?
 As promised, here are the thoughts of Soren Brage, an Investigator Scientist in Physical Activity at the MRC Epidemiology Unit in Cambridge on the recent BBC Horizon program featuring Michael Moseley taking part in a TV experiment to see how good high-intensity training (HIT) might be for his health.